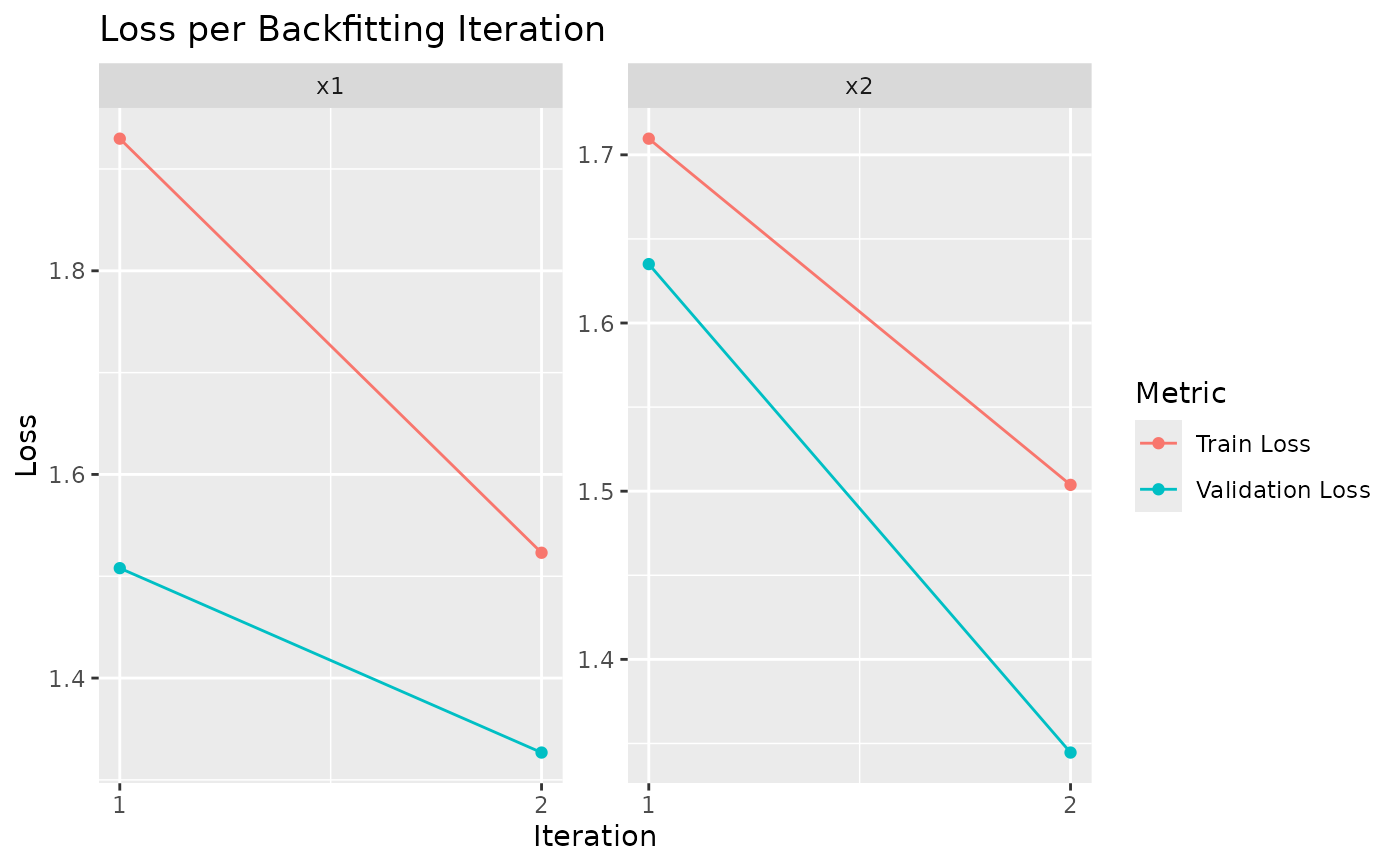
This function visualizes the training and/or validation loss at the end of each backfitting iteration
for each term-specific model in a fitted neuralGAM object. It is designed to work with the
history component of a trained neuralGAM model.
plot_history(model, select = NULL, metric = c("loss", "val_loss"))Arguments
Value
A ggplot object showing the loss curves by backfitting iteration, with facets per term.
Examples
# \dontrun{
set.seed(123)
n <- 200
x1 <- runif(n, -2, 2)
x2 <- runif(n, -2, 2)
y <- 2 + x1^2 + sin(x2) + rnorm(n, 0, 0.1)
df <- data.frame(x1 = x1, x2 = x2, y = y)
model <- neuralGAM::neuralGAM(
y ~ s(x1) + s(x2),
data = df,
num_units = 8,
family = "gaussian",
max_iter_backfitting = 2,
max_iter_ls = 1,
learning_rate = 0.01,
seed = 42,
validation_split = 0.2,
verbose = 0
)
plot_history(model) # Plot all terms
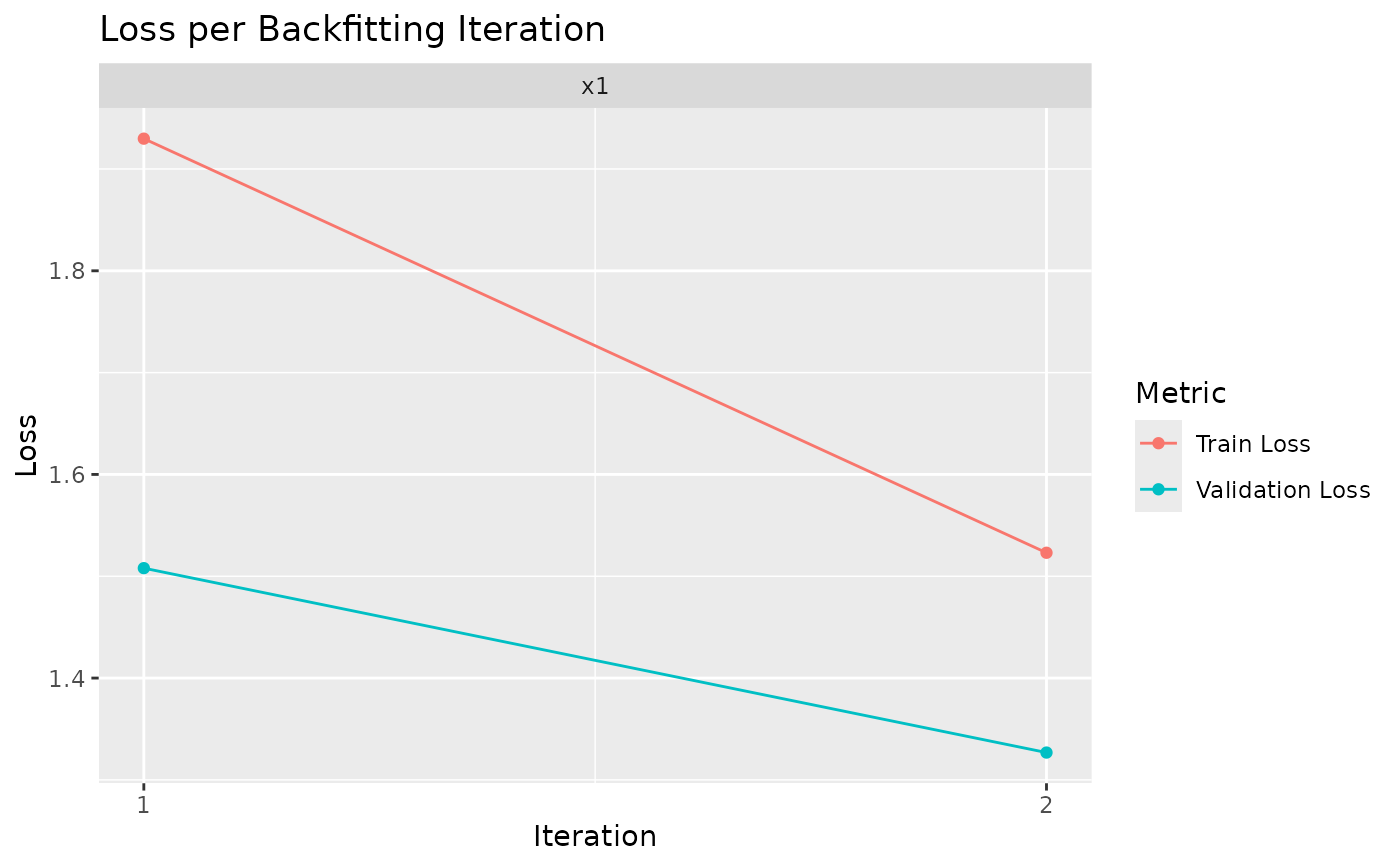
 plot_history(model, select = "x1") # Plot just x1
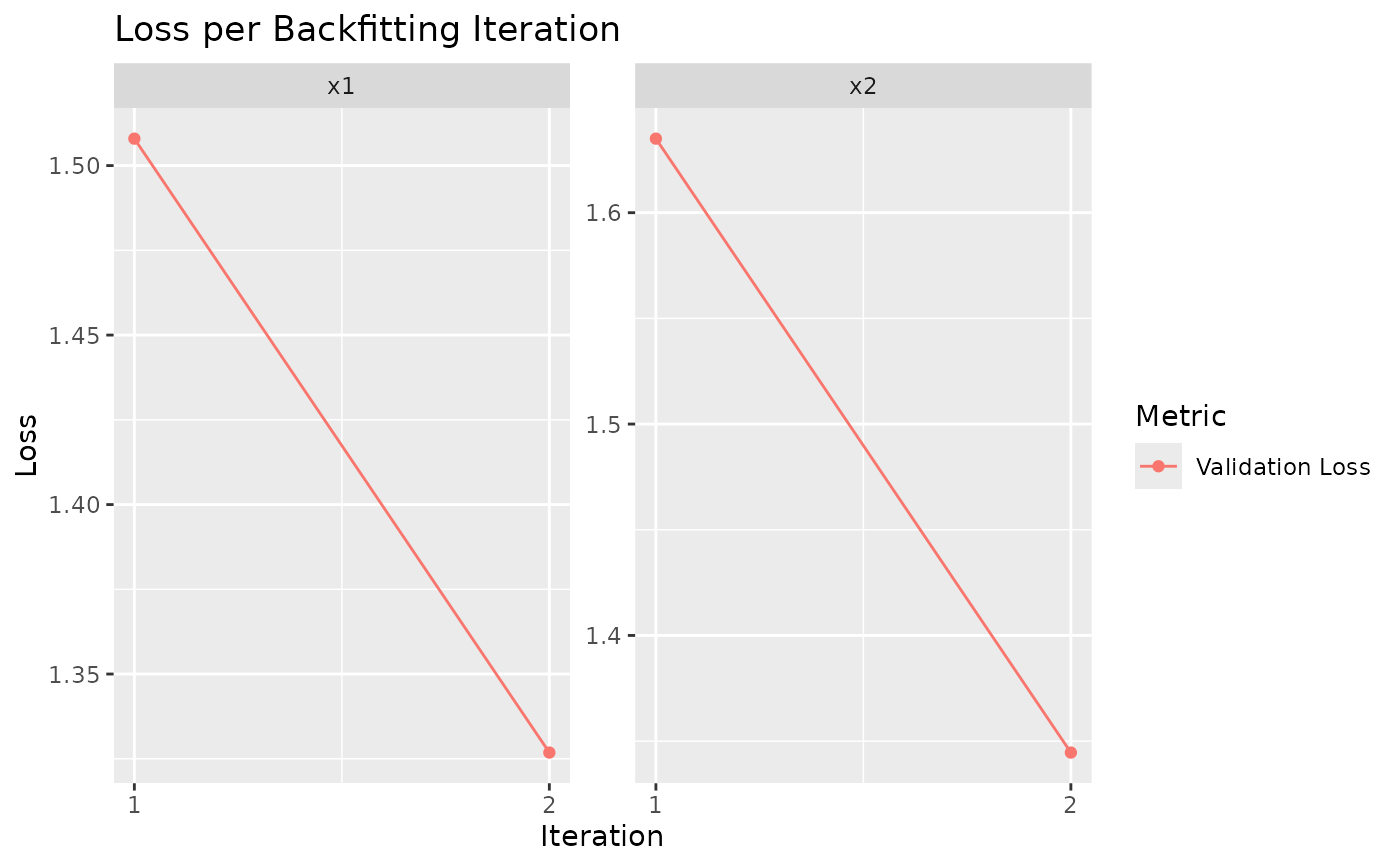
 plot_history(model, metric = "val_loss") # Plot only validation loss
 # }
# }