Autoplot method for neuralGAM objects (epistemic-only)
Source: R/autoplot.neuralGAM.R
autoplot.neuralGAM.RdProduce effect/diagnostic plots from a fitted neuralGAM model.
Supported panels:
which = "response": fitted response vs. index, with optional epistemic confidence intervals (CI).which = "link": linear predictor (link scale) vs. index, with optional CI.which = "terms": single per-term contribution \(g_j(x_j)\) on the link scale, with optional CI band for the smooth (epistemic).
Arguments
- object
A fitted
neuralGAMobject.- newdata
Optional
data.frame/list of covariates. If omitted, training data are used.- which
One of
c("response","link","terms"). Default"response".- interval
One of
c("none","confidence"). Default"confidence".- level
Coverage level for confidence intervals (e.g.,
0.95). Default0.95.- forward_passes
Integer. Number of MC-dropout forward passes used when
uncertainty_method %in% c("epistemic","both").- term
Single term name to plot when
which = "terms".- rug
Logical; if
TRUE(default), add rugs to continuous term plots.- ...
Additional arguments passed to
predict.neuralGAM.
Value
A single ggplot object.
Details
Uncertainty semantics (epistemic only)
CI: Uncertainty about the fitted mean.
For the response, SEs are mapped via the delta method;
For terms, bands are obtained as \(\hat g_j \pm z \cdot SE(\hat g_j)\) on the link scale.
Examples
# \dontrun{
library(neuralGAM)
dat <- sim_neuralGAM_data()
train <- dat$train
test <- dat$test
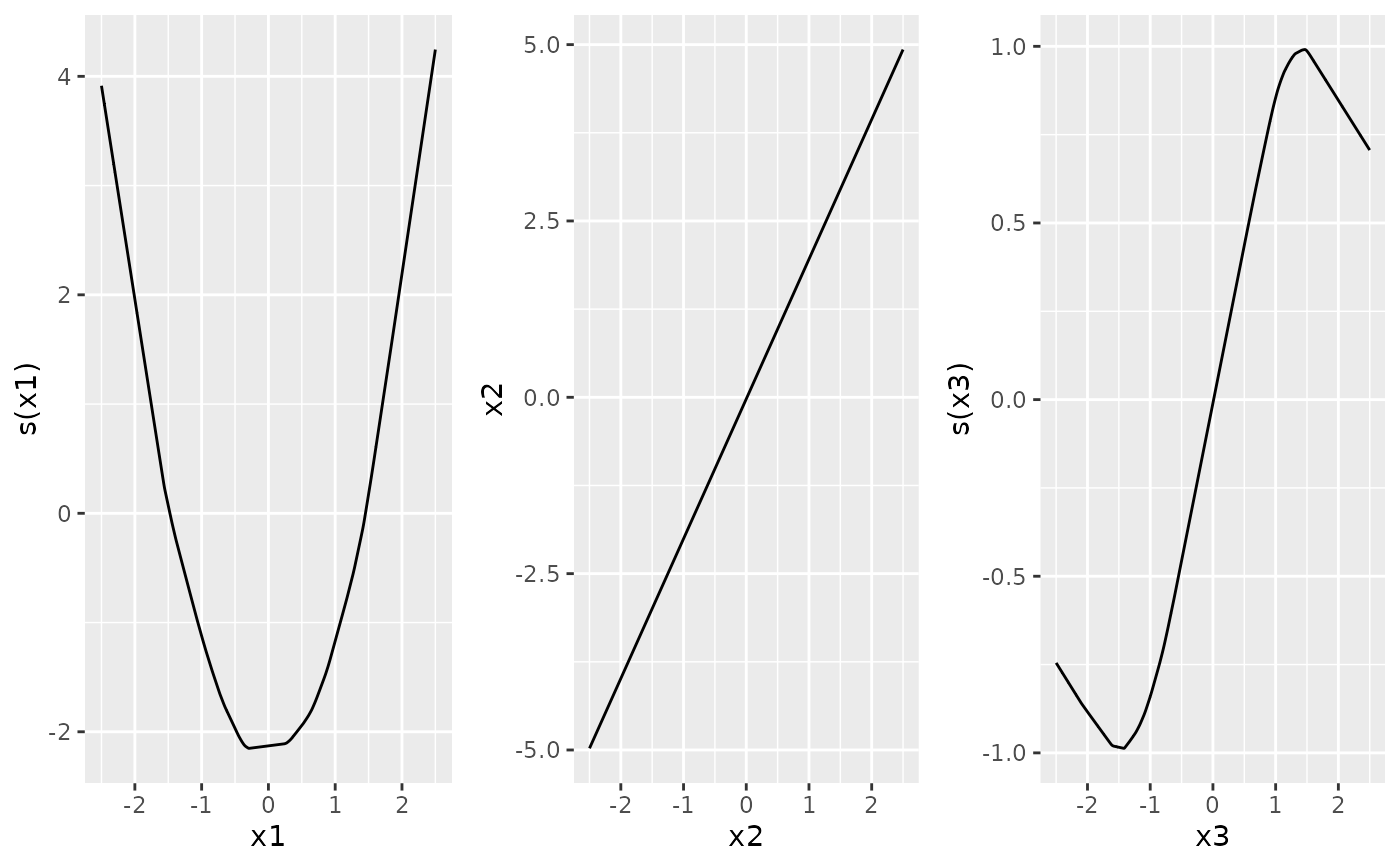
ngam <- neuralGAM(
y ~ s(x1) + x2 + s(x3),
data = train, family = "gaussian", num_units = 128,
uncertainty_method = "epistemic", forward_passes = 10
)
#> [1] "Initializing neuralGAM..."
#> [1] "BACKFITTING Iteration 1 - Current Err = 0.0179225412384158 BF Threshold = 0.001 Converged = FALSE"
#> [1] "BACKFITTING Iteration 2 - Current Err = 0.00269827024426018 BF Threshold = 0.001 Converged = FALSE"
#> [1] "BACKFITTING Iteration 3 - Current Err = 0.00209150988416186 BF Threshold = 0.001 Converged = FALSE"
#> [1] "BACKFITTING Iteration 4 - Current Err = 0.00206938827736226 BF Threshold = 0.001 Converged = FALSE"
#> [1] "BACKFITTING Iteration 5 - Current Err = 0.00322880542675333 BF Threshold = 0.001 Converged = FALSE"
#> [1] "BACKFITTING Iteration 6 - Current Err = 0.00137417950571183 BF Threshold = 0.001 Converged = FALSE"
#> [1] "BACKFITTING Iteration 7 - Current Err = 0.000676360330557372 BF Threshold = 0.001 Converged = TRUE"
#> [1] "Computing CI/PI using uncertainty_method = epistemic at alpha = 0.05"
## --- Autoplot (epistemic-only) ---
# Per-term effect with CI band
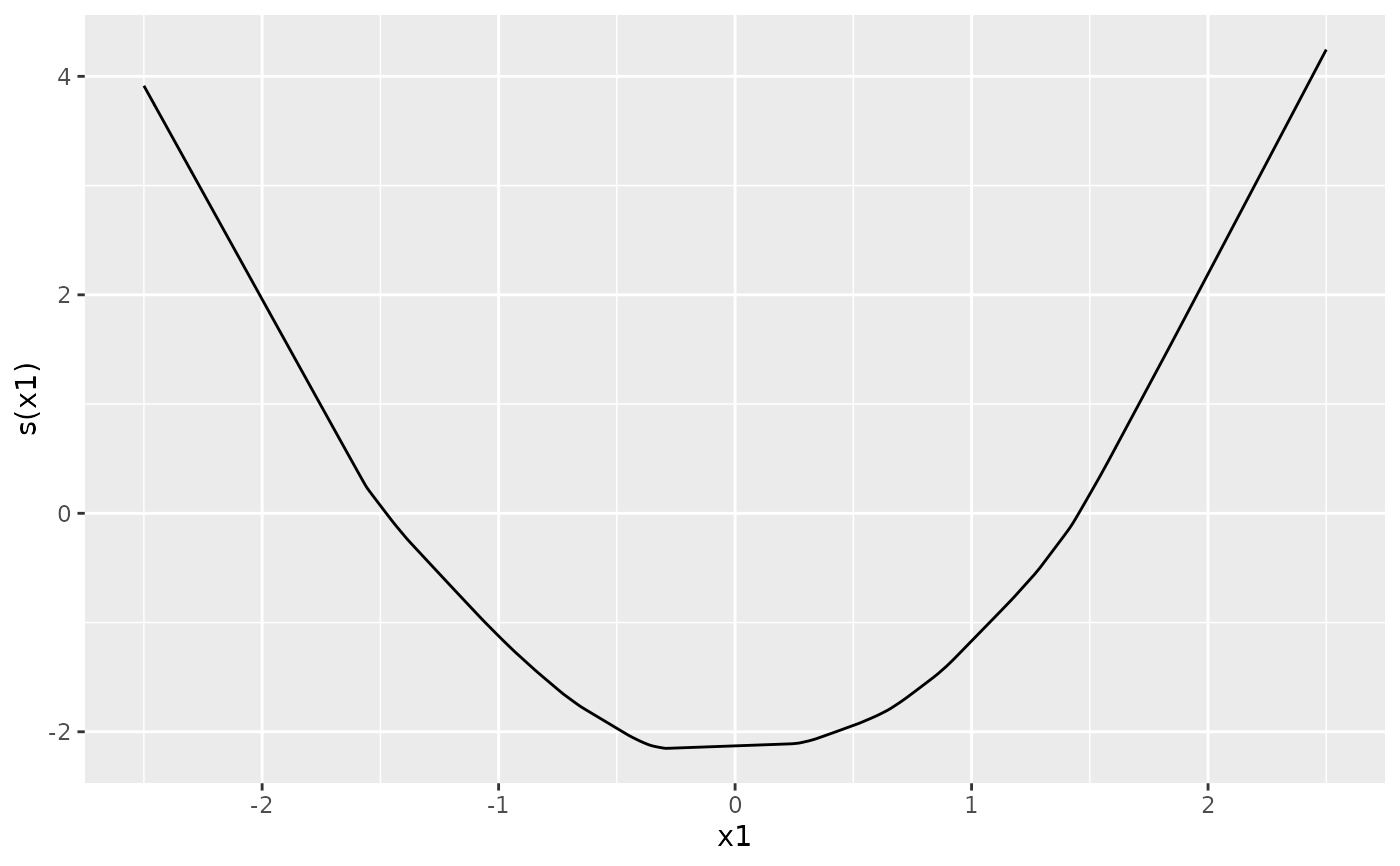
autoplot(ngam, which = "terms", term = "x1", interval = "confidence") +
ggplot2::xlab("x1") + ggplot2::ylab("Partial effect")
 # Request a different number of forward passes or CI level:
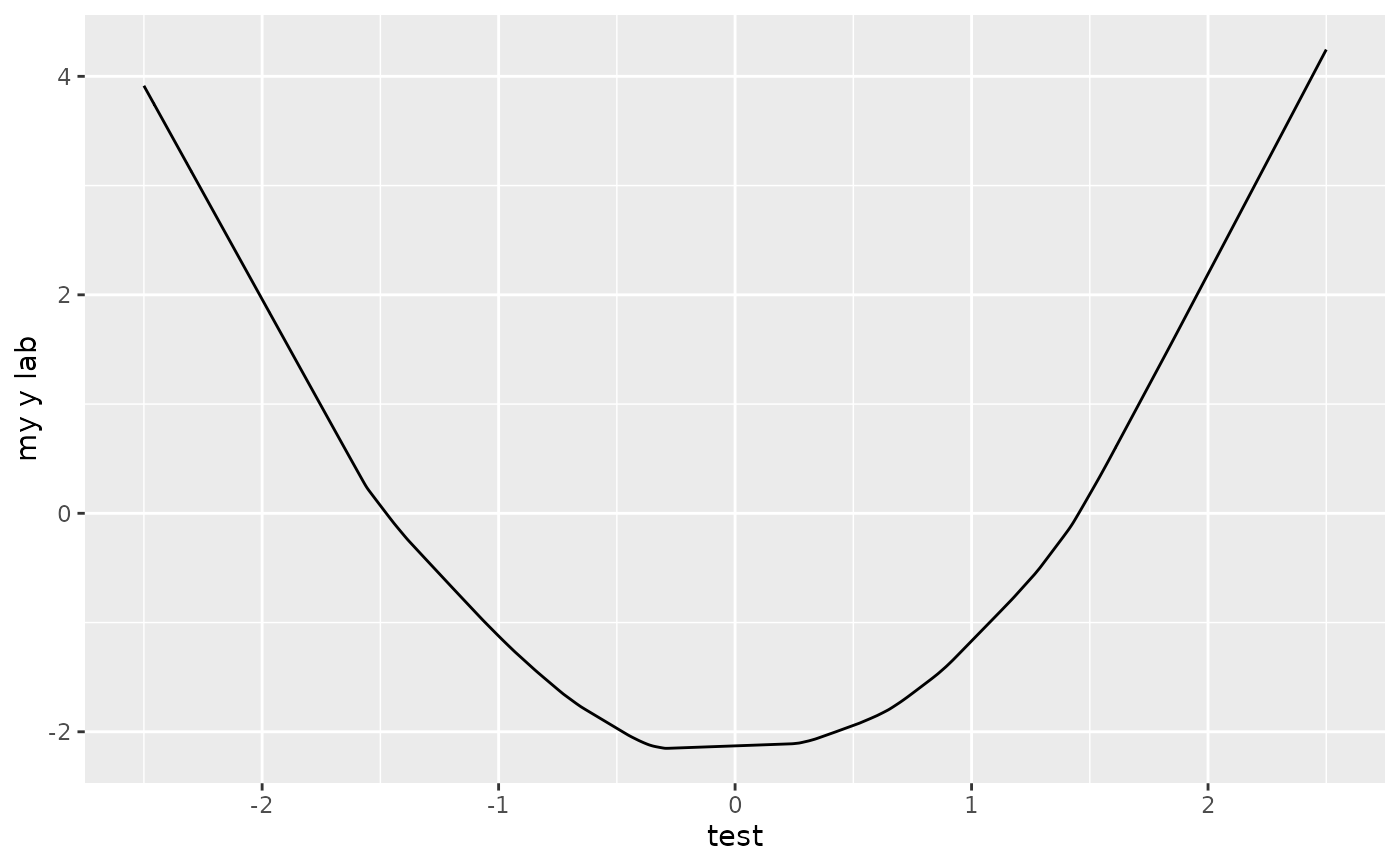
autoplot(ngam, which = "terms", term = "x1", interval = "confidence",
forward_passes = 15, level = 0.7)
# Request a different number of forward passes or CI level:
autoplot(ngam, which = "terms", term = "x1", interval = "confidence",
forward_passes = 15, level = 0.7)
 # Response panel
autoplot(ngam, which = "response")
# Response panel
autoplot(ngam, which = "response")
 # Link panel with custom title
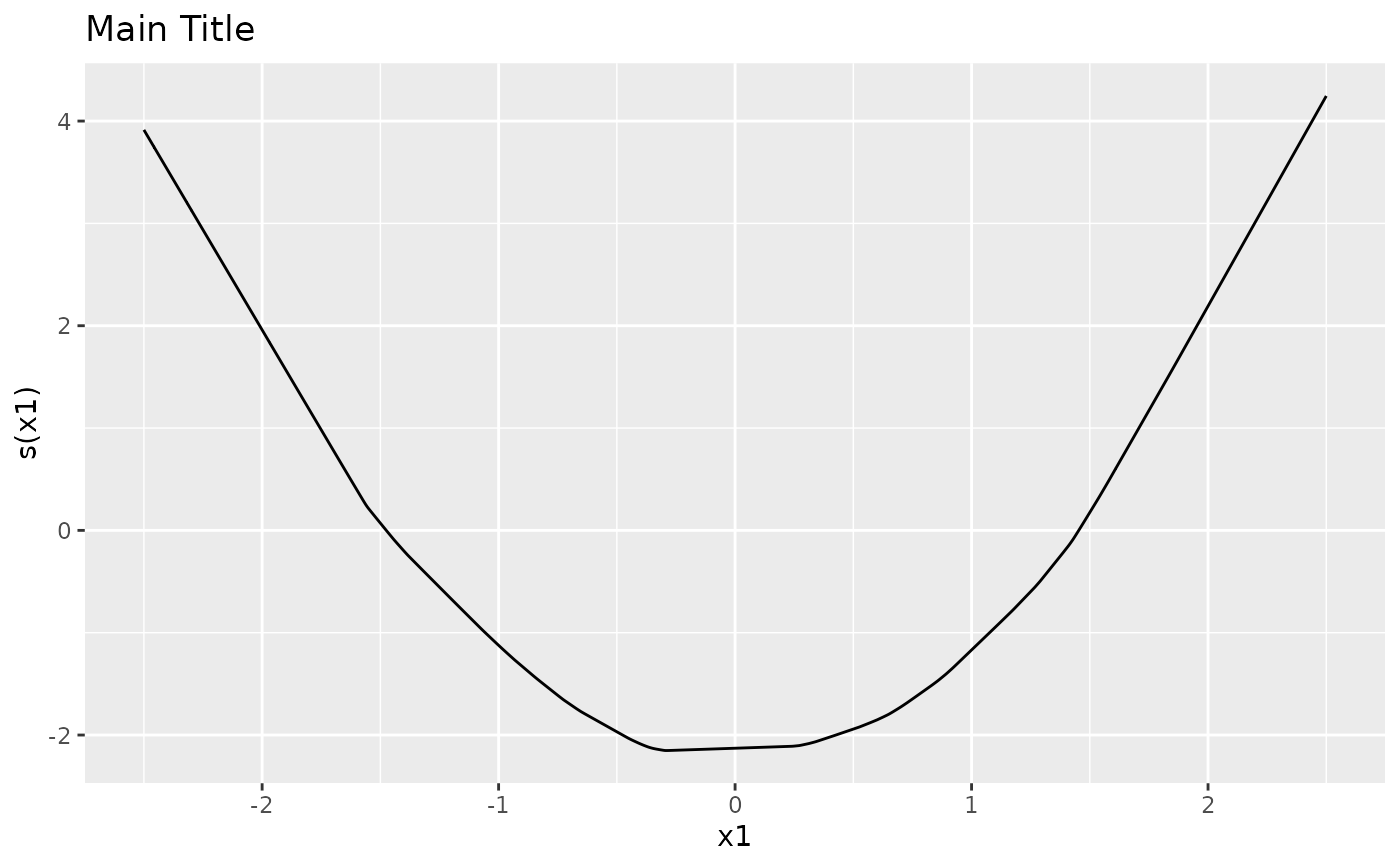
autoplot(ngam, which = "link") +
ggplot2::ggtitle("Main Title")
# Link panel with custom title
autoplot(ngam, which = "link") +
ggplot2::ggtitle("Main Title")
 # }
# }